Vampir meets SC22
We would like to welcome you at SC22 in Dallas! Our performance visualizer for parallel programs provides graphical visualization of massively parallel applications. Learn how we walk the road to exascale at our booth #927 from November 13 to November 18. Additionally, you can engage with our experts in various activities of the SC22 technical program. We showcase the latest version of our tool suite and introduce an early prototype to support TensorFlow- and PyTorch-applications technology that enables to analysis also large trace data not possible with browser based visualization.
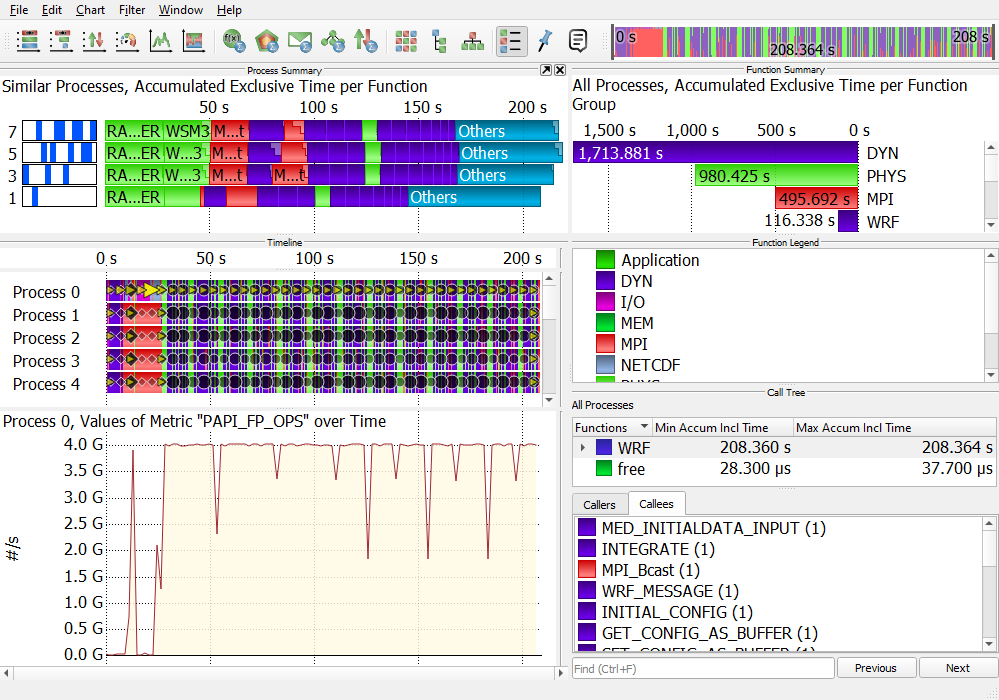
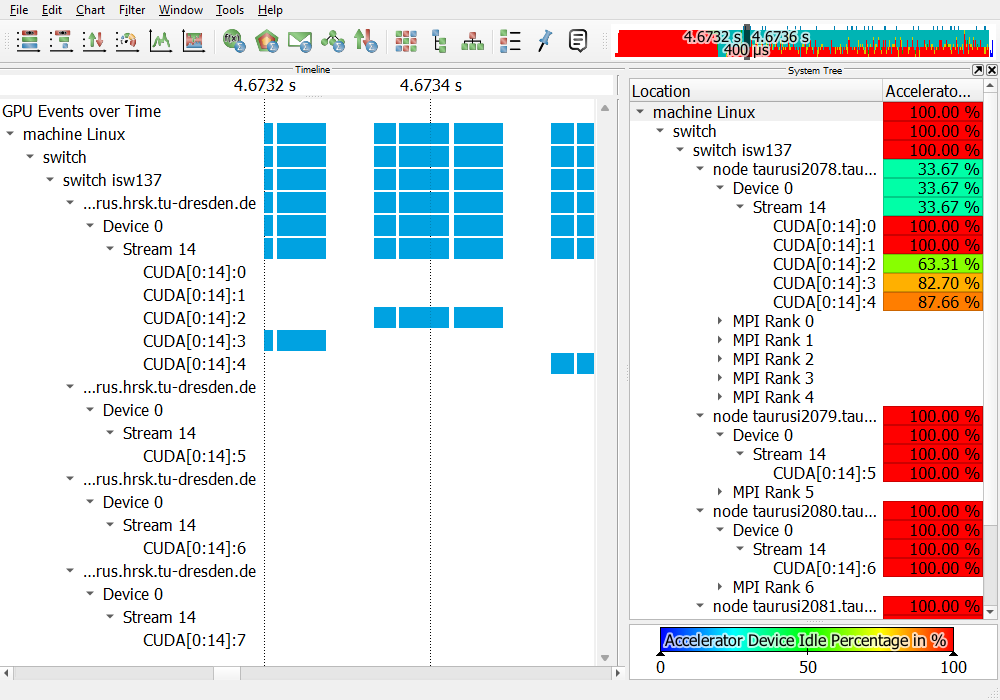
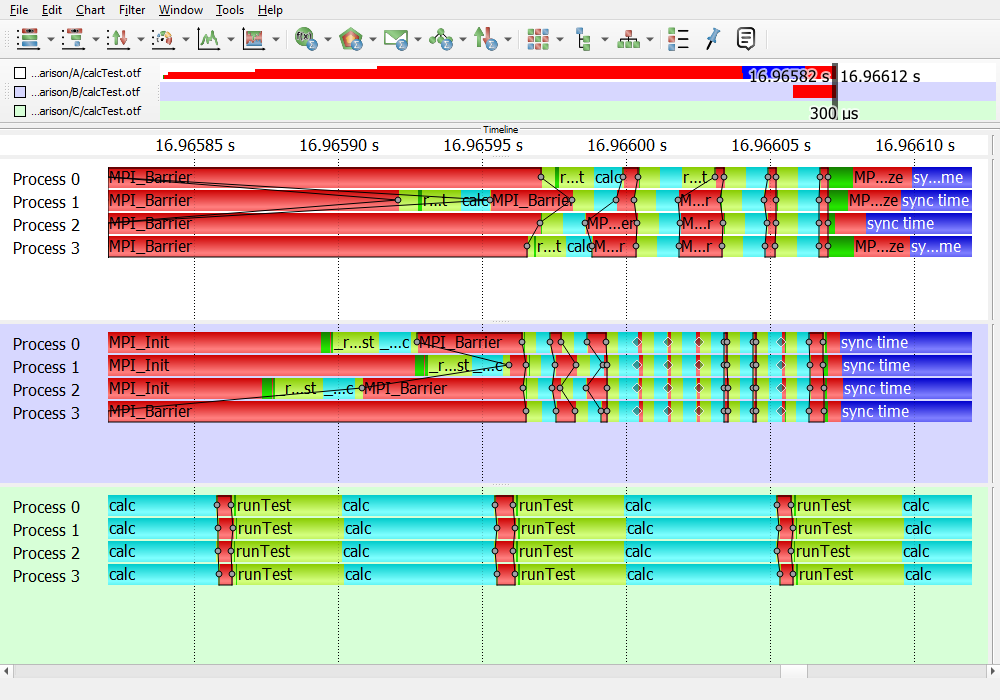
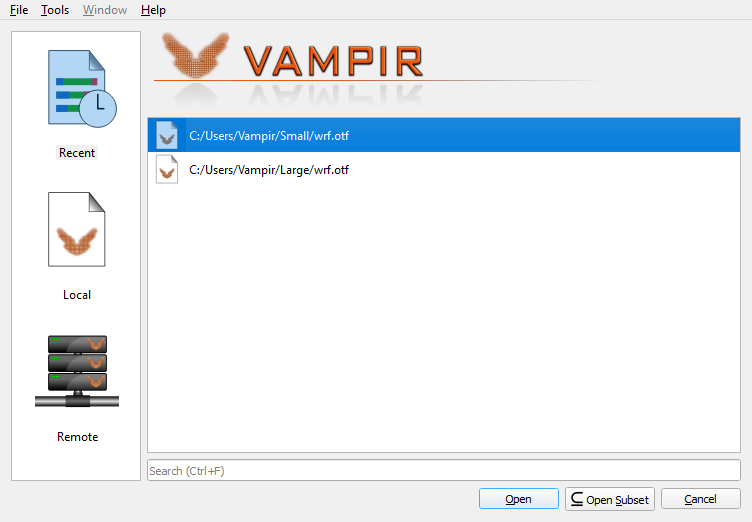
At SC22 we unveil Vampir 10.2 that provides the ability to show multiple metrics in the system tree chart, a redesigned file open dialog, customizable function names, extended custom metrics operations and filtering options, and IPv6 support for the client-server connection.
Vampir Website
Score-P is the primary code instrumentation and run-time measurement framework for Vampir 10, and also works natively with Scalasca, TAU, and Periscope.
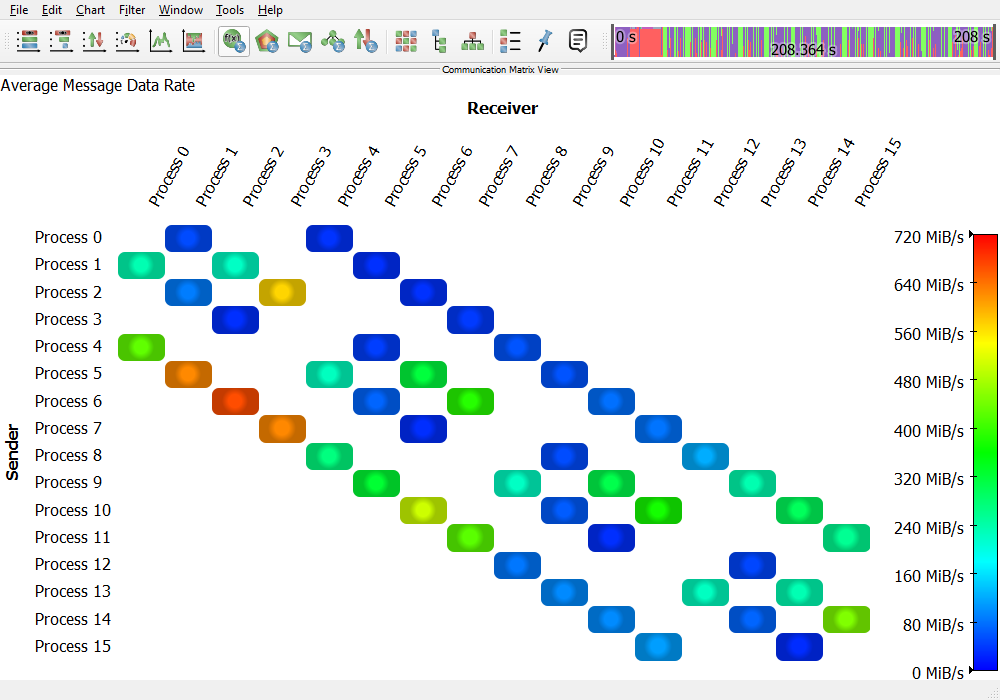
It supports an extensive set of events such as function and library calls, communication events, and hardware counters. Score-P supports various instrumentation methods, including instrumentation at source level and at compile/link time. Vampir and Score-P provide a performance tool framework with special focus on highly-parallel applications. Performance data is collected from multi-process (MPI, SHMEM), thread-parallel (OpenMP, Pthreads), as well as accelerator-based paradigms (CUDA, HIP, OpenCL, OpenACC).
Score-P Website
At SC22 we unveil Vampir 10.2 that provides the ability to show multiple metrics in the system tree chart, a redesigned file open dialog, customizable function names, extended custom metrics operations and filtering options, and IPv6 support for the client-server connection.
Vampir Website
Score-P is the primary code instrumentation and run-time measurement framework for Vampir 10, and also works natively with Scalasca, TAU, and Periscope.
It supports an extensive set of events such as function and library calls, communication events, and hardware counters. Score-P supports various instrumentation methods, including instrumentation at source level and at compile/link time. Vampir and Score-P provide a performance tool framework with special focus on highly-parallel applications. Performance data is collected from multi-process (MPI, SHMEM), thread-parallel (OpenMP, Pthreads), as well as accelerator-based paradigms (CUDA, HIP, OpenCL, OpenACC).
Score-P Website
Our events on SC22
| Time | Room | Type | Title |
|---|---|---|---|
| Sun, 13th November 04:30 PM - 05:00 PM | C143-149 | Workshop | Performance Analysis of the CFD Solver CODA - Harnessing Synergies between Application and Performance Tools Developers |
| Mon, 14th November 08:30 AM - 05:00 PM | D171 | Tutorial | Hands-On Practical Hybrid Parallel Application Performance Engineering |
| Tue, 15th November 12:15 AM - 01:15 PM | D165 | Birds-of-a-Feather | Experience with SPEChpc2021 benchmark suite on ZIH's cluster Taurus |
| Wed, 16th November 08:30 AM - 05:00 PM | C1-2-3 | Research Poster | A Light-Weight and Unsupervised Method for Near Real-time Anomaly Detection Using Operational Data Measurement |