Vampir meets ISC 2016
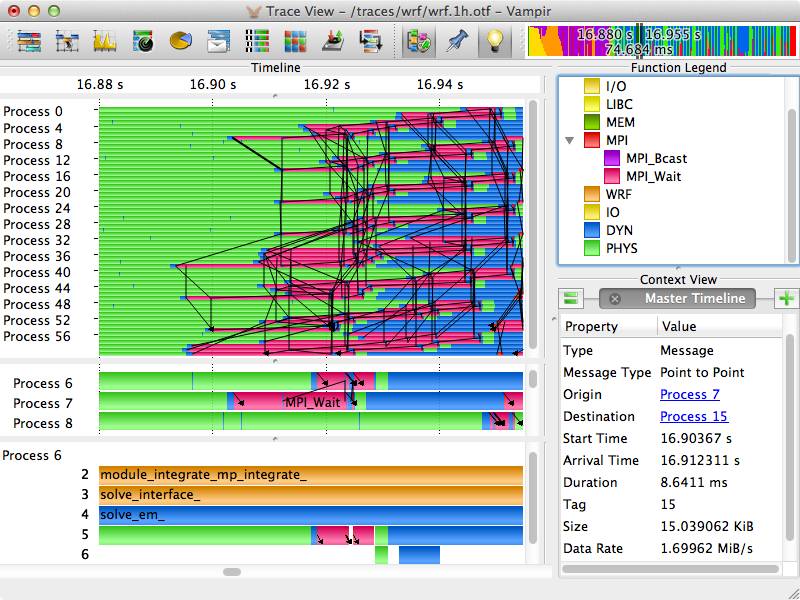
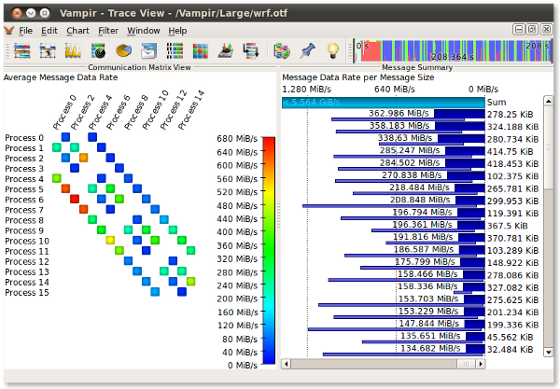
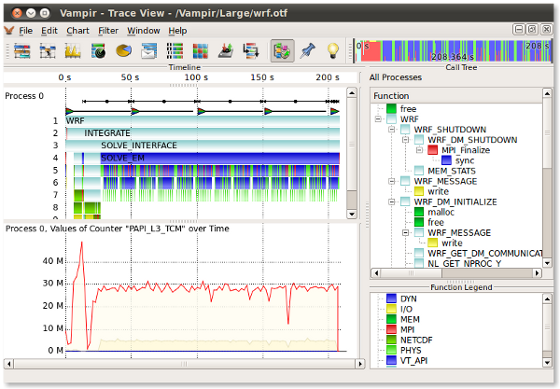
We would like to welcome you at ISC High Performance 2016 in the city of Frankfurt! Our performance visualizer for parallel programs provides graphical visualization of massively parallel applications. Learn how we walk the road to exascale at our booth #1250 from June 19 to June 23. Additionally, you can engage with our experts in various activities of the ISC 2016 technical program. We showcase the latest version of our tool suite and introduce a sampling technology that drastically simplifies performance optimization.
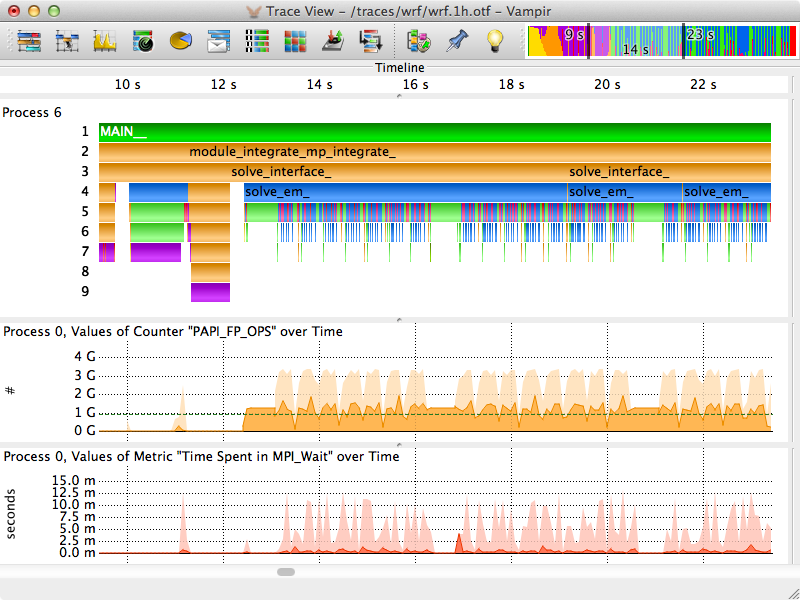
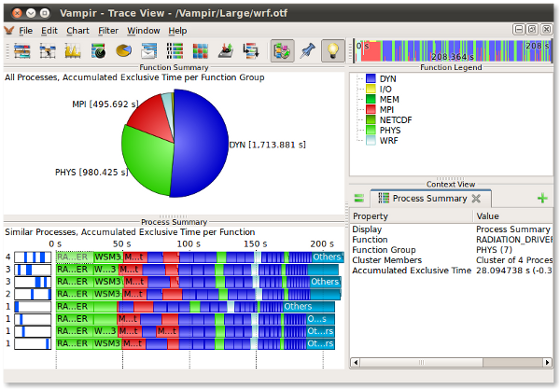
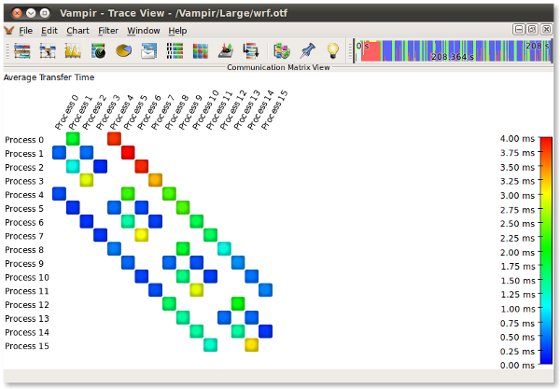
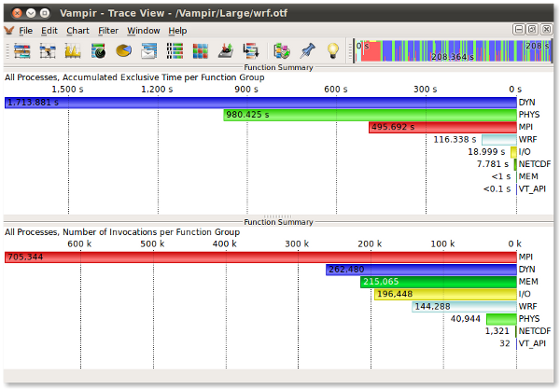
At ISC 2016 we unveil Vampir 9.1 that introduces new performance charts, customizable performance metrics, extended grouping and filtering, and new support for sampling traces.
Selected highlights include:
Vampir Website
Score-P is the primary code instrumentation and run-time measurement framework for Vampir 9, and also works natively with Scalasca, TAU, and Periscope.
The latest version 3.0 provides numerous improvements and new features.
Selected highlights include:
Score-P Website
At ISC 2016 we unveil Vampir 9.1 that introduces new performance charts, customizable performance metrics, extended grouping and filtering, and new support for sampling traces.
Selected highlights include:
- Combined visualization of instrumented and sampled events ensures a coherent performance analysis experience
- Sampling related statistics and counter metrics allow an even deeper understanding of measurement data and application behavior alike
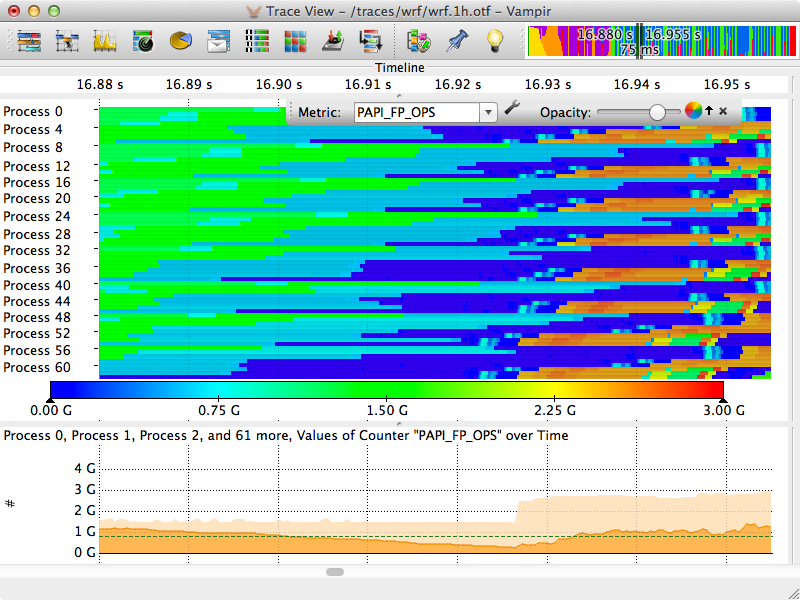
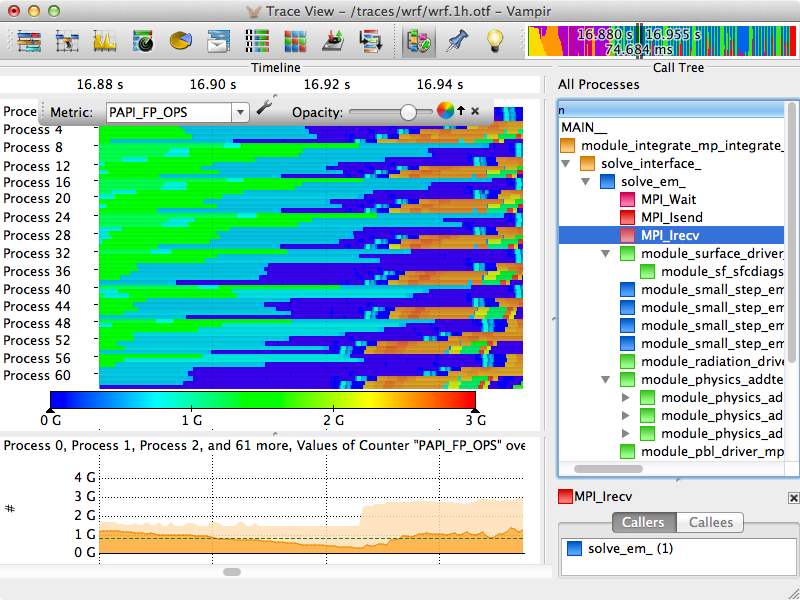
- New visualization of the system tree together with summarized metric values and the usage of customizable process groups simplify the analysis of the parallel behavior that impacts performance.
- Support for traces generated by Score-P 3.0.
Vampir Website
Score-P is the primary code instrumentation and run-time measurement framework for Vampir 9, and also works natively with Scalasca, TAU, and Periscope.
The latest version 3.0 provides numerous improvements and new features.
Selected highlights include:
- Support for instrumentation of OpenACC codes based on the profiling interface specified in OpenACC 2.5.
- Extract enhanced topology information from the Slurm topology tree plugin.
Score-P Website
Additional information material
 Vampir
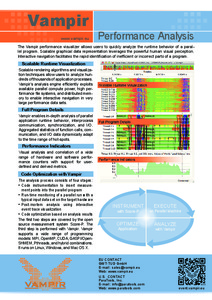 Vampir
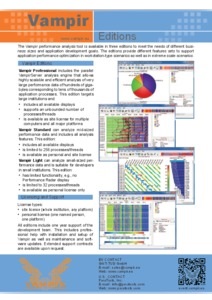 Vampir Editions
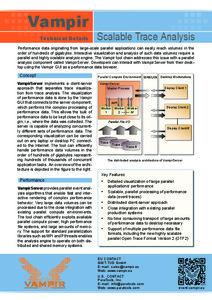 Vampir Scalable
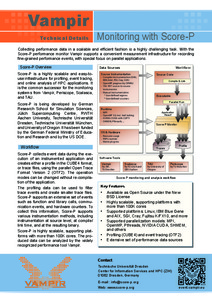 Vampir Monitoring
Our events on International Supercomputing Conference 2016
| Time | Room | Type | Title |
|---|---|---|---|
| Sun, 19th June 09:00 AM - 06:00 PM | Analog 1, Forum | Tutorial | Hands-on Practical Hybrid Parallel Application Performance Engineering |
| Mon, 20th June 01:00 PM - 03:00 PM | Panorama 1, Forum | PhD Forum | Toward Resilience in HPC: A Prototype to Analyze & Predict System Behavior |
| Thu, 23rd June 09:00 AM - 01:00 PM | Ampere, Marriott Hotel | Energy-Aware High Performance Computing (EnA-HPC) | Hands-on Practical Hybrid Parallel Application Performance Engineering |