Vampir meets ISC 2017
We would like to welcome you at ISC High Performance 2017 in the city of Frankfurt! Our performance visualizer for parallel programs provides graphical visualization of massively parallel applications. Learn how we walk the road to exascale at our booth J-622 from June 18 to June 22. Additionally, you can engage with our experts in various activities of the ISC 2017 technical program. We showcase the latest version of our tool suite and introduce a sampling technology that drastically simplifies performance optimization.
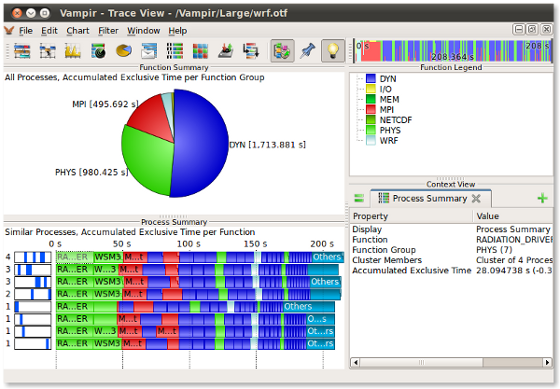
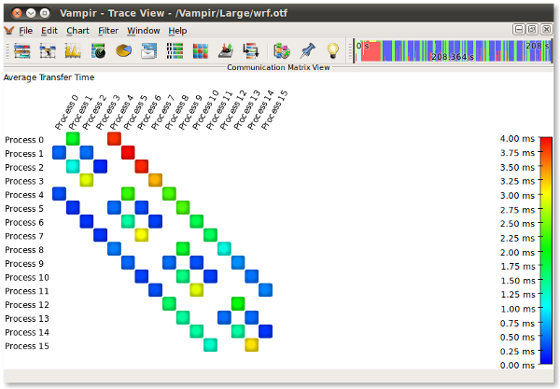
At ISC 2017 we unveil Vampir 9.3 that provides new performance charts, customizable performance metrics, extended grouping and filtering, and new support for sampling traces.
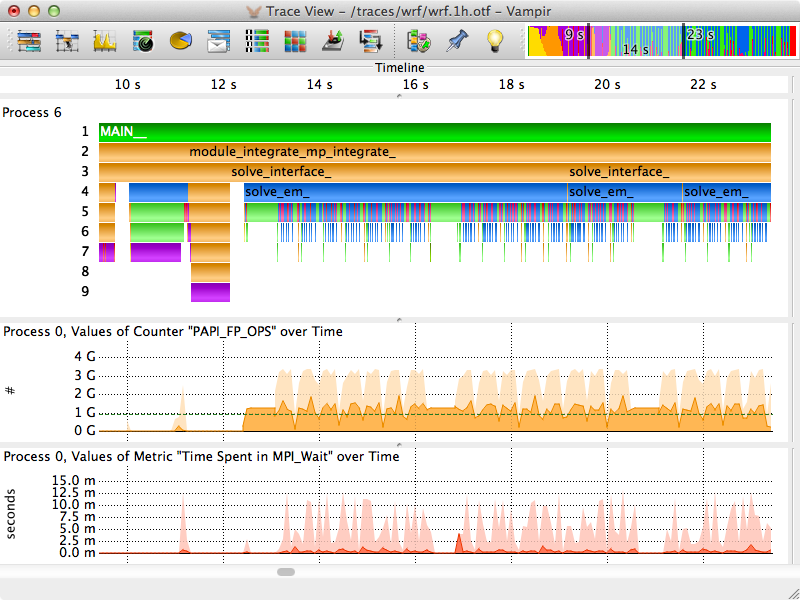
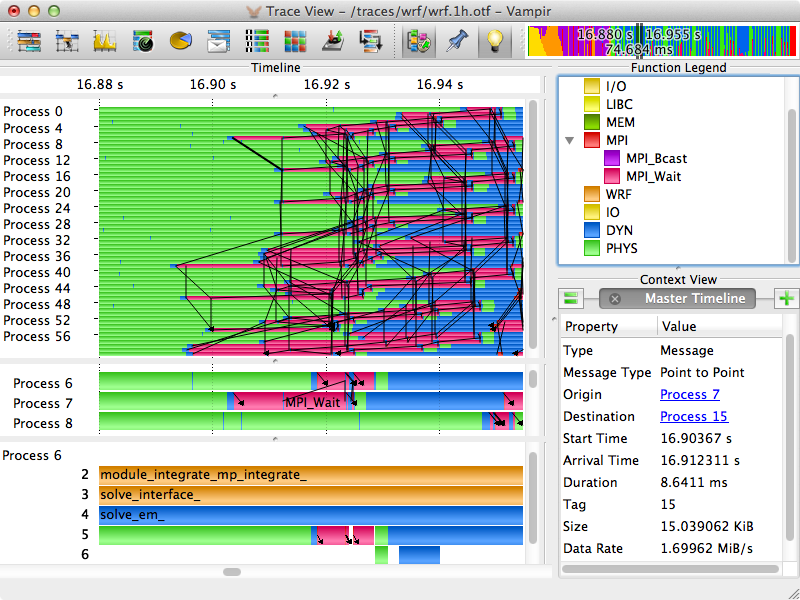
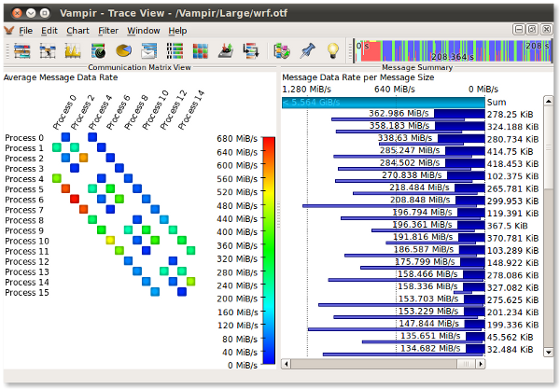
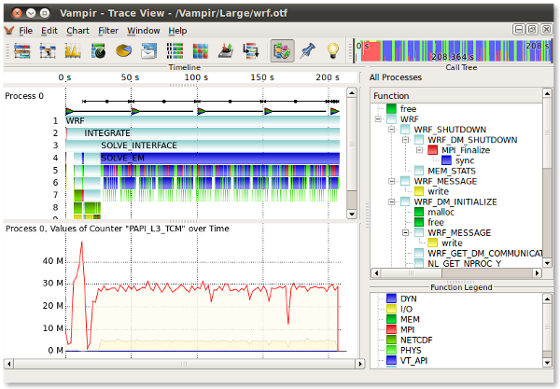
Today, the combined handling and visualization of instrumented and sampled event traces generated by Score-P enables an outstanding performance analysis capability of highly-parallel applications. Event and sampling-based statistics or counter metrics and a set of continuously extended and improved interactive visualizations in Vampir allow a detailed understanding of the complex application behavior. Current developments also include the analysis of memory and I/O behavior that often impacts an application's performance. In the near future, Vampir will introduce support for the in-situ analysis of running applications.
Vampir Website
Score-P is the primary code instrumentation and run-time measurement framework for Vampir 9, and also works natively with Scalasca, TAU, and Periscope.
It supports an extensive set of events such as function and library calls, communication events, and hardware counters. Score-P supports various instrumentation methods, including instrumentation at source level and at compile/link time. Recently, experimental support for sampling has been added. Vampir and Score-P provide a performance tool framework with special focus on highly-parallel applications. Performance data is collected from multi-process (MPI, SHMEM), thread-parallel (OpenMP, Pthreads), as well as accelerator-based paradigms (CUDA, OpenCL, OpenACC).
Score-P Website
At ISC 2017 we unveil Vampir 9.3 that provides new performance charts, customizable performance metrics, extended grouping and filtering, and new support for sampling traces.
Today, the combined handling and visualization of instrumented and sampled event traces generated by Score-P enables an outstanding performance analysis capability of highly-parallel applications. Event and sampling-based statistics or counter metrics and a set of continuously extended and improved interactive visualizations in Vampir allow a detailed understanding of the complex application behavior. Current developments also include the analysis of memory and I/O behavior that often impacts an application's performance. In the near future, Vampir will introduce support for the in-situ analysis of running applications.
Vampir Website
Score-P is the primary code instrumentation and run-time measurement framework for Vampir 9, and also works natively with Scalasca, TAU, and Periscope.
It supports an extensive set of events such as function and library calls, communication events, and hardware counters. Score-P supports various instrumentation methods, including instrumentation at source level and at compile/link time. Recently, experimental support for sampling has been added. Vampir and Score-P provide a performance tool framework with special focus on highly-parallel applications. Performance data is collected from multi-process (MPI, SHMEM), thread-parallel (OpenMP, Pthreads), as well as accelerator-based paradigms (CUDA, OpenCL, OpenACC).
Score-P Website
Additional information material
 Vampir
 Vampir
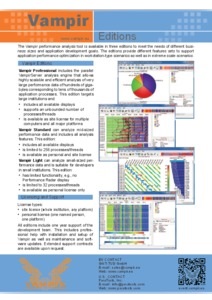 Vampir Editions
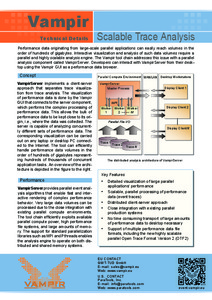 Vampir Scalable
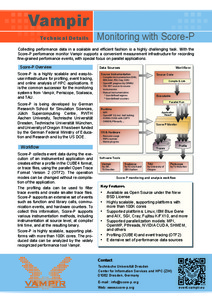 Vampir Monitoring
Our events on International Supercomputing Conference 2017
| Time | Room | Type | Title |
|---|---|---|---|
| Sun, 18th June 09:00 AM - 06:00 PM | Analog 1, Forum | Tutorial | Understanding & Improving I/O Performance on HPC Systems |
| Sun, 18th June 09:00 AM - 06:00 PM | Analog 2, Forum | Tutorial | Hands-on Practical Hybrid Parallel Application Performance Engineering |
| Tue, 20th June 08:35 PM - 09:45 PM | Substanz 1+2 | Poster | Event Pattern Identification in Anonymized System Logs |
| Wed, 21st June 03:46 PM - 04:45 PM | Panorama 2, Messe Frankfurt | Panel | Energy Efficiency in HPC |
| Thu, 22nd June 09:00 AM - 06:00 PM | Megabyte, Frankfurt Marriot Hotel | Workshop | Energy-Aware High Performance Computing (EnA-HPC) |